Chapter 1. Concepts and tools
Chapter 1. Concepts and tools
In this chapter, we’ll introduce the key Microsoft Windows operating system (OS) concepts and terms we’ll be using throughout this book, such as the Windows API, processes, threads, virtual memory, kernel mode and user mode, objects, handles, security, and the registry. We’ll also introduce the tools that you can use to explore Windows internals, such as the kernel debugger, the Performance Monitor, and key tools from Windows Sysinternals (http://www.microsoft.com/technet/sysinternals). In addition, we’ll explain how you can use the Windows Driver Kit (WDK) and the Windows Software Development Kit (SDK) as resources for finding further information on Windows internals.
Be sure that you understand everything in this chapter; the remainder of the book is written assuming that you do.
Windows operating system versions
This book covers the most recent version of the Microsoft Windows client and server operating systems: Windows 10 (32-bit on x86 and ARM, and 64-bit version on x64) and Windows Server 2016 (which exists as 64-bit version only). Unless specifically stated, the text applies to all versions. As background information, Table 1-1 lists the Windows product names, their internal version number, and their release date.


The version numbers seem to have strayed from a well-defined path starting with Windows 7. Its version number was 6.1 and not 7. Because of the popularity of Windows XP, when Windows Vista bumped the version number to 6.0, some applications failed to detect the correct (OS) because developers checked major numbers greater than or equal to 5 and minor numbers greater than or equal to 1, which was not the case with Windows Vista. Having learned the lesson, Microsoft chose to leave the major version number as 6 and the minor version number as 2 (greater than 1) to minimize such incompatibilities. However, with Windows 10, the version number has been updated to 10.0.
![]() Note
Note
Starting with Windows 8, the GetVersionEx Windows API function returns the OS version number as 6.2 (Windows 8) by default, regardless of the actual OS. (The function is also declared as deprecated.) This is done to minimize compatibility issues but also as an indicator that checking for the OS version is not the best approach in most cases. This is because some components can be installed out of band, without coinciding with an official Windows release. Still, if you need the actual OS version, you can obtain it indirectly by using the VerifyVersionInfo function or the newer version helper APIs, such as IsWindows8OrGreater, IsWindows8Point1OrGreater, IsWindows10OrGreater, IsWindowsServer, and similar. Also, OS compatibility can be indicated in the executable’s manifest, which changes the results of this function. (See the section “Image Loader,” in Chapter 3 for details.)
You can view the Windows version information using the ver command-line tool or graphically by running winver. Here’s a screenshot of winver on Windows 10 Enterprise version 1511:
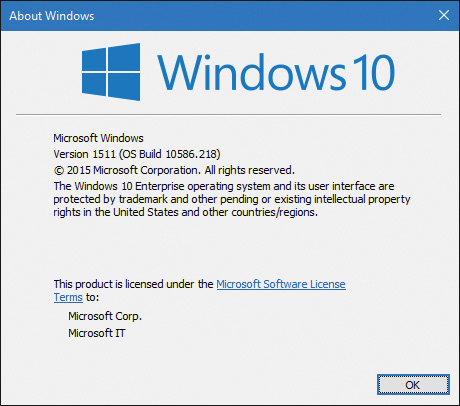
The graphic also shows the Windows build number (10586.218 in this example), which could be useful for Windows Insiders (those who registered for getting earlier previews of Windows). It’s also helpful for managing security updates because it shows which patch level is installed.
Windows 10 and future Windows versions
With Windows 10, Microsoft declared it will update Windows at a faster cadence than before. There will not be an official “Windows 11”; instead, Windows Update (or another enterprise servicing model) will update the existing Windows 10 to a new version. At the time of writing, two such updates have occurred, in November 2015 (also known as version 1511, referring to the year and month of servicing) and July 2016 (version 1607, also known by the marketing name of Anniversary Update).
![]() Note
Note
Internally, Microsoft still builds Windows versions in waves. For example, the initial Windows 10 release was code-named Threshold 1, while the November 2015 update was called Threshold 2. The next three phases of update are called Redstone 1 (version 1607) to be followed by Redstone 2 and Redstone 3.
Windows 10 and OneCore
Over the years, several flavors of Windows have evolved. Apart from mainstream Windows running on PCs, there is the Xbox 360 game console that runs a fork off Windows 2000. Windows Phone 7 runs a variant based on Windows CE (Microsoft’s real-time OS). Maintaining and extending all these code bases is clearly difficult. Therefore, Microsoft decided to converge the kernels and base platform support binaries into one. This started with Windows 8 and Windows Phone 8 having a shared kernel (and Windows 8.1 and Windows Phone 8.1 having a converged Windows Runtime API). With Windows 10, the convergence is complete; this shared platform is known as OneCore, and it runs on PCs, phones, the Xbox One game console, the HoloLens and Internet of Things (IoT) devices such as the Raspberry Pi 2.
Clearly, all these device form factors are very different from one another. Some features simply don’t exist on some devices. For example, supporting a mouse or a physical keyboard on a HoloLens device may not make sense, so you can’t expect those parts to be present on the Windows 10 version for such a device. But the kernel, drivers, and base platform binaries are essentially the same (with registry-based and/or policy-based settings where they make sense for performance or other reasons). You’ll see one such policy example in the section “API Sets” in Chapter 3, “Processes and jobs.”
This book delves into the internals of the OneCore kernel, on whatever device it’s running on. The experiments in the book, however, are targeted to a desktop machine with a mouse and keyboard mostly for convenience, as it’s not easy (and sometimes officially impossible) to perform the experiments on other devices such as phones or the Xbox One.
Foundation concepts and terms
The following sections introduce the most fundamental concepts in Windows, which are essential to understanding the topics discussed in the rest of the book. Many of the concepts such as processes, threads, and virtual memory are discussed at length in subsequent chapters.
Windows API
The Windows application programming interface (API) is the user-mode system programming interface to the Windows OS family. Prior to the introduction of 64-bit versions of Windows, the programming interface to the 32-bit versions of the Windows OS was called the Win32 API to distinguish it from the original 16-bit Windows API, which was the programming interface to the original 16-bit versions of Windows. In this book, the term Windows API refers to both the 32-bit and 64-bit programming interfaces to Windows.
![]() Note
Note
We sometimes use the term Win32 API in lieu of Windows API. Either way, it still refers to the 32-bit and 64-bit variants.
![]() Note
Note
The Windows API is described in the Windows SDK documentation. (See the section “Windows Software Development Kit” later in this chapter.) This documentation is available free online at https://developer.microsoft.com/en-us/windows/desktop/develop. It is also included with all subscription levels to the Microsoft Developer Network (MSDN), Microsoft’s support program for developers. An excellent description of how to program the Windows base API is in the book Windows via C/C++, Fifth Edition by Jeffrey Richter and Christophe Nasarre (Microsoft Press, 2007).
Windows API flavors
The Windows API originally consisted of C-style functions only. Today, thousands of such functions exist for developers to use. C was the natural choice at the time of the inception of Windows because it was the lowest common denominator (that is, it could be accessed from other languages as well) and was low level enough to expose OS services. The downside was the sheer number of functions coupled with the lack of naming consistency and logical groupings (for example, C++ namespaces). One outcome of these difficulties resulted in some newer APIs using a different API mechanism: the Component Object Model (COM).
COM was originally created to enable Microsoft Office applications to communicate and exchange data between documents (such as embedding an Excel chart inside a Word document or a PowerPoint presentation). This ability is called Object Linking and Embedding (OLE). OLE was originally implemented using an old Windows messaging mechanism called Dynamic Data Exchange (DDE). DDE was inherently limited, which is why a new way of communication was developed: COM. In fact, COM initially was called OLE 2, released to the public circa 1993.
COM is based on two foundational principles. First, clients communicate with objects (sometimes called COM server objects) through interfaces—well-defined contracts with a set of logically related methods grouped under the virtual table dispatch mechanism, which is also a common way for C++ compilers to implement virtual functions dispatch. This results in binary compatibility and removal of compiler name mangling issues. Consequently, it is possible to call these methods from many languages (and compilers), such as C, C++, Visual Basic, .NET languages, Delphi and others. The second principle is that component implementation is loaded dynamically rather than being statically linked to the client.
The term COM server typically refers to a Dynamic Link Library (DLL) or an executable (EXE) where the COM classes are implemented. COM has other important features related to security, cross-process marshalling, threading model, and more. A comprehensive treatment of COM is beyond the scope of this book; an excellent treatment of COM can be found in the book Essential COM by Don Box (Addison- Wesley, 1998).
![]() Note
Note
Examples of APIs accessed through COM include DirectShow, Windows Media Foundation, DirectX, DirectComposition, Windows Imaging Component (WIC), and the Background Intelligent Transfer Service (BITS).
The Windows Runtime
Windows 8 introduced a new API and supporting runtime called the Windows Runtime (sometimes abbreviated WinRT, not to be confused with Windows RT, the discontinued ARM-based Windows OS version). The Windows Runtime consists of platform services aimed particularly at app developers for the so-called Windows Apps (formerly known as Metro Apps, Modern Apps, Immersive Apps, and Windows Store Apps). Windows Apps may target multiple device form factors, from small IoT devices to phones, tablets, laptops, desktops, and even devices such as the Xbox One and Microsoft HoloLens.
From an API perspective, WinRT is built on top of COM, adding various extensions to the base COM infrastructure. For example, complete type metadata is available in WinRT (stored in WINMD files and based on the .NET metadata format) that extends a similar concept in COM known as type libraries. From an API design perspective, it’s much more cohesive than classic Windows API functions, with namespace hierarchies, consistent naming, and programmatic patterns.
Windows Apps are subject to new rules, unlike the normal Windows applications (now called Windows desktop applications or Classic Windows applications). These rules are described in Chapter 9, “Management mechanisms,” in Part 2.
The relationship between the various APIs and applications is not straightforward. Desktop apps can use a subset of the WinRT APIs. Conversely, Windows Apps can use a subset of Win32 and COM APIs. Refer to the MSDN documentation for the details of which APIs are available from each application platform. Note, however, that at the basic binary level, the WinRT API is still based on top of the legacy Windows binaries and APIs, even though the availability of certain APIs may not be documented or supported. It is not a new “native” API for the system, much like .NET still leverages the traditional Windows API.
Applications written in C++, C# (or other .NET languages), and JavaScript can consume WinRT APIs easily thanks to language projections developed for these platforms. For C++, Microsoft created a non-standard extension known as C++/CX that makes it simpler to consume WinRT types. The normal COM interop layer for .NET (with some supporting run-time extensions) allows any .NET language to consume WinRT APIs naturally and simply just as if it were pure .NET. For JavaScript developers, an extension called WinJS was developed for accessing WinRT, although JavaScript developers must still use HTML to build their app’s user interface.
![]() Note
Note
Even though HTML can be used in Windows Apps, it’s still a local client app and not a web application retrieved from a web server.
The .NET Framework
The .NET Framework is part of Windows. Table 1-2 shows the .NET Framework version installed as part of a given Windows version. However, a later version of the .NET Framework can be installed on older OS versions.

The .NET Framework consists of two major components:
![]() The Common Language Runtime (CLR) This is the run-time engine for .NET and includes a Just In Time (JIT) compiler that translates Common Intermediate Language (CIL) instructions to the underlying hardware CPU machine language, a garbage collector, type verification, code access security, and more. It’s implemented as a COM in-process server (DLL) and uses various facilities provided by the Windows API.
The Common Language Runtime (CLR) This is the run-time engine for .NET and includes a Just In Time (JIT) compiler that translates Common Intermediate Language (CIL) instructions to the underlying hardware CPU machine language, a garbage collector, type verification, code access security, and more. It’s implemented as a COM in-process server (DLL) and uses various facilities provided by the Windows API.
![]() The .NET Framework Class Library (FCL) This is a large collection of types that implement functionality typically needed by client and server applications, such as user interface services, networking, database access, and much more.
The .NET Framework Class Library (FCL) This is a large collection of types that implement functionality typically needed by client and server applications, such as user interface services, networking, database access, and much more.
By offering these features and others, including new high-level programming languages (C#, Visual Basic, F#) and supporting tools, the .NET Framework improves developer productivity and increases safety and reliability within applications that target it. Figure 1-1 shows the relationship between the .NET Framework and the OS.

Services, functions, and routines
Several terms in the Windows user and programming documentation have different meanings in different contexts. For example, the word service can refer to a callable routine in the OS, a device driver, or a server process. The following list describes what certain terms mean in this book:
![]() Windows API functions These are documented, callable subroutines in the Windows API. Examples include
Windows API functions These are documented, callable subroutines in the Windows API. Examples include CreateProcess, CreateFile, and GetMessage.
![]() Native system services (or system calls) These are the undocumented, underlying services in the OS that are callable from user mode. For example,
Native system services (or system calls) These are the undocumented, underlying services in the OS that are callable from user mode. For example, NtCreateUserProcess is the internal system service the Windows CreateProcess function calls to create a new process.
![]() Kernel support functions (or routines) These are the subroutines inside the Windows OS that can be called only from kernel mode (defined later in this chapter). For example,
Kernel support functions (or routines) These are the subroutines inside the Windows OS that can be called only from kernel mode (defined later in this chapter). For example, ExAllocatePoolWithTag is the routine that device drivers call to allocate memory from the Windows system heaps (called pools).
![]() Windows services These are processes started by the Windows service control manager. For example, the Task Scheduler service runs in a user-mode process that supports the
Windows services These are processes started by the Windows service control manager. For example, the Task Scheduler service runs in a user-mode process that supports the schtasks command (which is similar to the UNIX commands at and cron). (Note that although the registry defines Windows device drivers as “services,” they are not referred to as such in this book.)
![]() Dynamic link libraries (DLLs) These are callable subroutines linked together as a binary file that can be dynamically loaded by applications that use the subroutines. Examples include Msvcrt.dll (the C run-time library) and Kernel32.dll (one of the Windows API subsystem libraries). Windows user-mode components and applications use DLLs extensively. The advantage DLLs provide over static libraries is that applications can share DLLs, and Windows ensures that there is only one in-memory copy of a DLL’s code among the applications that are referencing it. Note that library .NET assemblies are compiled as DLLs but without any unmanaged exported subroutines. Instead, the CLR parses compiled metadata to access the corresponding types and members.
Dynamic link libraries (DLLs) These are callable subroutines linked together as a binary file that can be dynamically loaded by applications that use the subroutines. Examples include Msvcrt.dll (the C run-time library) and Kernel32.dll (one of the Windows API subsystem libraries). Windows user-mode components and applications use DLLs extensively. The advantage DLLs provide over static libraries is that applications can share DLLs, and Windows ensures that there is only one in-memory copy of a DLL’s code among the applications that are referencing it. Note that library .NET assemblies are compiled as DLLs but without any unmanaged exported subroutines. Instead, the CLR parses compiled metadata to access the corresponding types and members.
Processes
Although programs and processes appear similar on the surface, they are fundamentally different. A program is a static sequence of instructions, whereas a process is a container for a set of resources used when executing the instance of the program. At the highest level of abstraction, a Windows process comprises the following:
![]() A private virtual address space This is a set of virtual memory addresses that the process can use.
A private virtual address space This is a set of virtual memory addresses that the process can use.
![]() An executable program This defines initial code and data and is mapped into the process’s virtual address space.
An executable program This defines initial code and data and is mapped into the process’s virtual address space.
![]() A list of open handles These map to various system resources such as semaphores, synchronization objects, and files that are accessible to all threads in the process.
A list of open handles These map to various system resources such as semaphores, synchronization objects, and files that are accessible to all threads in the process.
![]() A security context This is an access token that identifies the user, security groups, privileges, attributes, claims, capabilities, User Account Control (UAC) virtualization state, session, and limited user account state associated with the process, as well as the AppContainer identifier and its related sandboxing information.
A security context This is an access token that identifies the user, security groups, privileges, attributes, claims, capabilities, User Account Control (UAC) virtualization state, session, and limited user account state associated with the process, as well as the AppContainer identifier and its related sandboxing information.
![]() A process ID This is a unique identifier, which is internally part of an identifier called a client ID.
A process ID This is a unique identifier, which is internally part of an identifier called a client ID.
![]() At least one thread of execution Although an “empty” process is possible, it is (mostly) not useful.
At least one thread of execution Although an “empty” process is possible, it is (mostly) not useful.
A number of tools for viewing (and modifying) processes and process information are available. The following experiments illustrate the various views of process information you can obtain with some of these tools. While many of these tools are included within Windows itself, and within the Debugging Tools for Windows and the Windows SDK, others are stand-alone tools from Sysinternals. Many of these tools show overlapping subsets of the core process and thread information, sometimes identified by different names.
Probably the most widely used tool to examine process activity is Task Manager. (Because there is no such thing as a “task” in the Windows kernel, the name of this tool, Task Manager, is a bit odd.) The following experiment shows some of the basic features of Task Manager.
EXPERIMENT: Viewing process information with Task Manager
![]() Press Ctrl+Shift+Esc.
Press Ctrl+Shift+Esc.
![]() Right-click the taskbar and click Start Task Manager.
Right-click the taskbar and click Start Task Manager.
![]() Press Ctrl+Alt+Delete and click the Start Task Manager button.
Press Ctrl+Alt+Delete and click the Start Task Manager button.
![]() Start the executable Taskmgr.exe.
Start the executable Taskmgr.exe.


![]() Note
Note
The Windows 7 Task Manager’s Processes tab is roughly equivalent to Windows 8+ Task Manager’s Details tab. The Windows 7 Task Manager’s Applications tab shows top-level visible Windows and not processes per se. This information is now contained in the Processes tab of the new Windows 8+ Task Manager.


![]() Threads The Threads column shows the number of threads in each process. This number should normally be at least one, as there’s no direct way of creating a process with no threads (and such a process is pretty useless anyway). If a process shows zero threads, it usually means the process can’t be deleted for some reason—probably because of some buggy driver code.
Threads The Threads column shows the number of threads in each process. This number should normally be at least one, as there’s no direct way of creating a process with no threads (and such a process is pretty useless anyway). If a process shows zero threads, it usually means the process can’t be deleted for some reason—probably because of some buggy driver code.
![]() Handles The Handles column shows the number of handles to kernel objects opened by threads running within the process. (This is described later in this chapter and in detail in Chapter 8 in Part 2.)
Handles The Handles column shows the number of handles to kernel objects opened by threads running within the process. (This is described later in this chapter and in detail in Chapter 8 in Part 2.)
![]() Status The Status column is a little bit tricky. For processes that don’t have any user interface, Running should be the normal case, although the threads may all be waiting for something, such as a kernel object being signaled or some I/O operation to complete. The other option for such processes is Suspended, and this happens if all the threads in the process are in a suspended state. This is unlikely to occur by the process itself, but can be achieved programmatically by calling the undocumented
Status The Status column is a little bit tricky. For processes that don’t have any user interface, Running should be the normal case, although the threads may all be waiting for something, such as a kernel object being signaled or some I/O operation to complete. The other option for such processes is Suspended, and this happens if all the threads in the process are in a suspended state. This is unlikely to occur by the process itself, but can be achieved programmatically by calling the undocumented NtSuspendProcess native API on the process, typically through a tool (for example, Process Explorer, described later, has such an option). For processes that create a user interface, the Running status value means that the UI is responsive. In other words, the thread that created the window(s) is waiting for UI input (technically, the message queue associated with the thread). The Suspended state is possible just like in the non-UI case, but for Windows Apps (those hosting the Windows Runtime), Suspended normally occurs when the app loses its foreground status by being minimized by the user. Such processes are suspended after 5 seconds so that they don’t consume any CPU or networking resources, thus allowing the new foreground app to get all machine resources. This is especially important for battery-powered devices, such as tablets and phones. This and other related mechanisms are described more fully in Chapter 9 in Part 2. The third possible value for Status is Not Responding. This can happen if a thread within the process that created the user interface has not checked its message queue for UI-related activity for at least 5 seconds. The process (actually the thread that owns the window) may be busy doing some CPU-intensive work or waiting on something else entirely (such as an I/O operation to complete). Either way, the UI freezes up, and Windows indicates that by fading the window(s) in question and appending “(Not Responding)” to its title.
Each process also points to its parent (which may be, but is not always, its creator process). If the parent no longer exists, this information is not updated. Therefore, it is possible for a process to refer to a nonexistent parent. This is not a problem, because nothing relies on this information being kept current. In the case of the Process Explorer tool, the start time of the parent process is taken into account to avoid attaching a child process based on a reused process ID. The following experiment illustrates this behavior.
Why would a parent process not be the same as its creator? In certain cases, some processes that appear to be created by a certain user application might involve the help of a broker, or helper, process, which is responsible for calling the process creation API. In such cases, it would be confusing (and sometimes incorrect, if handle or address space inheritance is needed) to display the broker process as the creator, and a “re-parenting” is done. You’ll learn about one such example in Chapter 7, “Security.”
EXPERIMENT: Viewing the process tree
System Process (0)
System (4)
smss.exe (360)
csrss.exe (460)
wininit.exe (524)
services.exe (648)
svchost.exe (736)
unsecapp.exe (2516)
WmiPrvSE.exe (2860)
WmiPrvSE.exe (2512)
RuntimeBroker.exe (3104)
SkypeHost.exe (2776)
ShellExperienceHost.exe (3760) Windows Shell Experience Host
ApplicationFrameHost.exe (2848) OleMainThreadWndName
SearchUI.exe (3504) Cortana
WmiPrvSE.exe (1576)
TiWorker.exe (6032)
wuapihost.exe (5088)
svchost.exe (788)
svchost.exe (932)
svchost.exe (960)
svchost.exe (976)
svchost.exe (68)
svchost.exe (380)
VSSVC.exe (1124)
svchost.exe (1176)
sihost.exe (3664)
taskhostw.exe (3032) Task Host Window
svchost.exe (1212)
svchost.exe (1636)
spoolsv.exe (1644)
svchost.exe (1936)
OfficeClickToRun.exe (1324)
MSOIDSVC.EXE (1256)
MSOIDSVCM.EXE (2264)
MBAMAgent.exe (2072)
MsMpEng.exe (2116)
SearchIndexer.exe (1000)
SearchProtocolHost.exe (824)
svchost.exe (3328)
svchost.exe (3428)
svchost.exe (4400)
svchost.exe (4360)
svchost.exe (3720)
TrustedInstaller.exe (6052)
lsass.exe (664)
csrss.exe (536)
winlogon.exe (600)
dwm.exe (1100) DWM Notification Window
explorer.exe (3148) Program Manager
OneDrive.exe (4448)
cmd.exe (5992) C:\windows\system32\cmd.exe - tlist /t
conhost.exe (3120) CicMarshalWnd
tlist.exe (5888)
SystemSettingsAdminFlows.exe (4608)
1. Press WinKey+R, type cmd, and press Enter to open a Command Prompt window.
2. Type title Parent to change the title of the window to Parent.
3. Type start cmd to open a second Command Prompt window.
4. Type title Child in the second Command Prompt window.
5. Type mspaint in the second Command Prompt window to start Microsoft Paint.
6. Go back to the second Command Prompt window and type exit. Notice that Paint remains.
7. Press Ctrl+Shift+Esc to open Task Manager.
8. If Task Manager is in “less details” mode, click More Details.
9. Click the Processes tab.
10. Find the Windows Command Processor app and expand its node. You should see the title Parent, as in the following screenshot:

11. Right-click the Windows Command Processor entry and select Go to details.
12. Right-click this cmd.exe process and select End Process Tree.
13. Click End Process Tree in the Task Manager confirmation dialog box.
Process Explorer, from Sysinternals, shows more details about processes and threads than any other available tool, which is why you will see it used in a number of experiments throughout the book. Following are some of the unique things that Process Explorer shows or enables:
![]() A process security token, such as lists of groups and privileges and the virtualization state
A process security token, such as lists of groups and privileges and the virtualization state
![]() Highlighting to show changes in the process, thread, DLLs, and handles list
Highlighting to show changes in the process, thread, DLLs, and handles list
![]() A list of services inside service-hosting processes, including the display name and description
A list of services inside service-hosting processes, including the display name and description
![]() A list of additional process attributes, such as mitigation policies and their process protection level
A list of additional process attributes, such as mitigation policies and their process protection level
![]() Processes that are part of a job and job details
Processes that are part of a job and job details
![]() Processes hosting .NET applications and .NET-specific details, such as the list of AppDomains, loaded assemblies, and CLR performance counters
Processes hosting .NET applications and .NET-specific details, such as the list of AppDomains, loaded assemblies, and CLR performance counters
![]() Processes that host the Windows Runtime (immersive processes)
Processes that host the Windows Runtime (immersive processes)
![]() The start time for processes and threads
The start time for processes and threads
![]() A complete list of memory-mapped files (not just DLLs)
A complete list of memory-mapped files (not just DLLs)
![]() The ability to suspend a process or a thread
The ability to suspend a process or a thread
![]() The ability to kill an individual thread
The ability to kill an individual thread
![]() Easy identification of which processes were consuming the most CPU over a period of time
Easy identification of which processes were consuming the most CPU over a period of time
![]() Note
Note
The Performance Monitor can display process CPU utilization for a given set of processes, but it won’t automatically show processes created after the performance-monitoring session has started. Only a manual trace in binary output format can do that.
Process Explorer also provides easy access to information in one place, such as the following:
![]() A process tree, with the ability to collapse parts of the tree
A process tree, with the ability to collapse parts of the tree
![]() Open handles in a process, including unnamed handles
Open handles in a process, including unnamed handles
![]() A list of DLLs (and memory-mapped files) in a process
A list of DLLs (and memory-mapped files) in a process
![]() Thread activity within a process
Thread activity within a process
![]() User-mode and kernel-mode thread stacks, including the mapping of addresses to names using the Dbghelp.dll that comes with the Debugging Tools for Windows
User-mode and kernel-mode thread stacks, including the mapping of addresses to names using the Dbghelp.dll that comes with the Debugging Tools for Windows
• More accurate CPU percentage using the thread cycle count—an even better representation of precise CPU activity, as explained in Chapter 4, “Threads.”
• Integrity level
![]() Memory manager details such as peak commit charge and kernel memory paged and non-paged pool limits (other tools show only current size)
Memory manager details such as peak commit charge and kernel memory paged and non-paged pool limits (other tools show only current size)
An introductory experiment using Process Explorer follows.
EXPERIMENT: Viewing process details with Process Explorer

![]() Tip
Tip
You can configure the Microsoft symbol server by setting an environment variable named _NT_SYMBOL_PATH to the value shown in the preceding graphic. Various tools look for this variable automatically, such as Process Explorer, the debuggers that are part of the Debugging Tools for Windows, Visual Studio, and others. This will help you avoid having to configure each tool separately.
![]() The services inside a service-hosting process (for example, Svchost.exe)
The services inside a service-hosting process (for example, Svchost.exe)
![]() The tasks inside a task-hosting process (for example, TaskHostw.exe)
The tasks inside a task-hosting process (for example, TaskHostw.exe)
![]() The target of a Rundll32.exe process, used for Control Panel items and other features
The target of a Rundll32.exe process, used for Control Panel items and other features
![]() The COM class information when being hosted inside a Dllhost.exe process (also known as the default COM+ surrogate)
The COM class information when being hosted inside a Dllhost.exe process (also known as the default COM+ surrogate)
![]() Provider information for Windows Management Instrumentation (WMI) host processes such as WMIPrvSE.exe (see Chapter 8 in Part 2 for more on WMI)
Provider information for Windows Management Instrumentation (WMI) host processes such as WMIPrvSE.exe (see Chapter 8 in Part 2 for more on WMI)
![]() Package information for Windows Apps processes (processes hosting the Windows Runtime, briefly discussed in “The Windows Runtime” section earlier in this chapter)
Package information for Windows Apps processes (processes hosting the Windows Runtime, briefly discussed in “The Windows Runtime” section earlier in this chapter)

1. Notice that processes hosting services are highlighted by default in pink. Your own processes are highlighted in blue. You can change these colors by opening the drop-down menu, selecting Options, and choosing Configure Colors.
2. Hover your mouse pointer over the image name for processes. Notice that the tooltip displays the full path. As noted, certain types of processes have additional details in the tooltip.
3. In the Process Image tab, click View, choose Select Columns, and add the image path.
4. Click the Process column head to sort the processes. Notice that the tree view disappears. (You can either display the tree view or sort by any of the columns shown.) Click the Process column head again to sort from Z to A. Click it a third time to return the display to tree view.
5. Open the View menu and deselect Show Processes from All Users to show only your processes.
6. Click the Options menu, choose Difference Highlight Duration, and change the value to 3 seconds. Then launch a new process (anything). Notice that the new process is highlighted in green for 3 seconds. Exit this new process, and notice that the process is highlighted in red for 3 seconds before disappearing from the display. This can be useful for seeing processes being created and exiting on your system.
7. Double-click a process and explore the various tabs available from the process properties display. (These will be referenced in various experiments throughout the book where the information being shown is being explained.)
Threads
A thread is an entity within a process that Windows schedules for execution. Without it, the process’s program can’t run. A thread includes the following essential components:
![]() The contents of a set of CPU registers representing the state of the processor
The contents of a set of CPU registers representing the state of the processor
![]() Two stacks—one for the thread to use while executing in kernel mode and one for executing in user mode
Two stacks—one for the thread to use while executing in kernel mode and one for executing in user mode
![]() A private storage area called thread-local storage (TLS) for use by subsystems, run-time libraries, and DLLs
A private storage area called thread-local storage (TLS) for use by subsystems, run-time libraries, and DLLs
![]() A unique identifier called a thread ID (part of an internal structure called a client ID; process IDs and thread IDs are generated out of the same namespace, so they never overlap)
A unique identifier called a thread ID (part of an internal structure called a client ID; process IDs and thread IDs are generated out of the same namespace, so they never overlap)
In addition, threads sometimes have their own security context, or token, which is often used by multithreaded server applications that impersonate the security context of the clients that they serve.
The volatile and non-volatile registers as well as a private storage area are called the thread’s context. Because this information is different for each machine architecture that Windows runs on, this structure, by necessity, is architecture-specific. The Windows GetThreadContext function provides access to this architecture specific information (called the CONTEXT block). Additionally, each thread has its own stack as well (pointed to by a stack register part of the thread’s context).
Because switching execution from one thread to another involves the kernel scheduler, it can be an expensive operation, especially if two threads are often switching between each other. Windows implements two mechanisms to reduce this cost: fibers and user-mode scheduling (UMS).
The threads of a 32-bit application running on a 64-bit version of Windows will contain both 32-bit and 64-bit contexts, which Wow64 (Windows on Windows 64-bit) will use to switch the application from running in 32-bit to 64-bit mode when required. These threads will have two user stacks and two CONTEXT blocks, and the usual Windows API functions will return the 64-bit context instead. The Wow64GetThreadContext function, however, will return the 32-bit context. See Chapter 8 in Part 2 for more information on Wow64.
Fibers
Fibers allow an application to schedule its own threads of execution rather than rely on the priority-based scheduling mechanism built into Windows. Fibers are often called lightweight threads. In terms of scheduling, they’re invisible to the kernel because they’re implemented in user mode in Kernel32.dll. To use fibers, you first make a call to the Windows ConvertThreadToFiber function. This function converts the thread to a running fiber. Afterward, the newly converted fiber can create additional fibers via the CreateFiber function. (Each fiber can have its own set of fibers.) Unlike a thread, however, a fiber doesn’t begin execution until it’s manually selected through a call to the SwitchToFiber function. The new fiber runs until it exits or until it calls SwitchToFiber, again selecting another fiber to run. For more information, see the Windows SDK documentation on fiber functions.
![]() Note
Note
Using fibers is usually not a good idea. This is because they are invisible to the kernel. They also have issues such as sharing thread local storage (TLS) because several fibers can be running on the same thread. Although fiber local storage (FLS) exists, this does not solve all sharing issues, and I/O-bound fibers will perform poorly regardless. Additionally, fibers cannot run concurrently on more than one processor, and are limited to cooperative multi-tasking only. In most scenarios, it’s best to let the Windows kernel handle scheduling by using the appropriate threads for the task at hand.
User-mode scheduling threads
User-mode scheduling (UMS) threads, which are available only on 64-bit versions of Windows, provide the same basic advantages as fibers—and only a few of the disadvantages. UMS threads have their own kernel thread state and are therefore visible to the kernel, which allows multiple UMS threads to issue blocking system calls and share and contend on resources. Or, when two or more UMS threads need to perform work in user mode, they can periodically switch execution contexts (by yielding from one thread to another) in user mode rather than involving the scheduler. From the kernel’s perspective, the same kernel thread is still running and nothing has changed. When a UMS thread performs an operation that requires entering the kernel (such as a system call), it switches to its dedicated kernel-mode thread (called a directed context switch). While concurrent UMS threads still cannot run on multiple processors, they do follow a pre-emptible model that’s not solely cooperative.
Although threads have their own execution context, every thread within a process shares the process’s virtual address space (in addition to the rest of the resources belonging to the process), meaning that all the threads in a process have full read-write access to the process virtual address space. Threads cannot accidentally reference the address space of another process, however, unless the other process makes available part of its private address space as a shared memory section (called a file mapping object in the Windows API) or unless one process has the right to open another process to use cross-process memory functions, such as ReadProcessMemory and WriteProcessMemory (which a process that’s running with the same user account, and not inside of an AppContainer or other type of sandbox, can get by default unless the target process has certain protections).
In addition to a private address space and one or more threads, each process has a security context and a list of open handles to kernel objects such as files, shared memory sections, or one of the synchronization objects such as mutexes, events, or semaphores, as illustrated in Figure 1-2.

Each process’s security context is stored in an object called an access token. The process access token contains the security identification and credentials for the process. By default, threads don’t have their own access token, but they can obtain one, thus allowing individual threads to impersonate the security context of another process—including processes on a remote Windows system—without affecting other threads in the process. (See Chapter 7 for more details on process and thread security.)
The virtual address descriptors (VADs) are data structures that the memory manager uses to keep track of the virtual addresses the process is using. These data structures are described in more depth in Chapter 5.
Jobs
Windows provides an extension to the process model called a job. A job object’s main function is to allow the management and manipulation of groups of processes as a unit. A job object allows control of certain attributes and provides limits for the process or processes associated with the job. It also records basic accounting information for all processes associated with the job and for all processes that were associated with the job but have since terminated. In some ways, the job object compensates for the lack of a structured process tree in Windows—yet in many ways it is more powerful than a UNIX-style process tree.
Process Explorer can show processes managed by a job using a default color of brown, but it’s not enabled by default (to enable it, open the Options menu and choose Configure Colors). Furthermore, the property pages of such a process have an additional Job tab that gives information on the job object itself.
You’ll find out much more about the internal structure of processes and jobs in Chapter 3 and about threads and thread-scheduling algorithms in Chapter 4.
Virtual memory
Windows implements a virtual memory system based on a flat (linear) address space that provides each process with the illusion of having its own large, private address space. Virtual memory provides a logical view of memory that might not correspond to its physical layout. At run time, the memory manager—with assistance from hardware—translates, or maps, the virtual addresses into physical addresses, where the data is actually stored. By controlling the protection and mapping, the OS can ensure that individual processes don’t bump into each other or overwrite OS data.
Because most systems have much less physical memory than the total virtual memory in use by the running processes, the memory manager transfers, or pages, some of the memory contents to disk. Paging data to disk frees physical memory so that it can be used for other processes or for the OS itself. When a thread accesses a virtual address that has been paged to disk, the virtual memory manager loads the information back into memory from disk.
Applications don’t have to be altered in any way to take advantage of paging because hardware support enables the memory manager to page without the knowledge or assistance of processes or threads. Figure 1-3 shows two processes using virtual memory in which parts are mapped to physical memory (RAM) while other parts are paged to disk. Notice that contiguous virtual memory chunks may be mapped to non-contiguous chunks in physical memory. These chunks are called pages, and have a default size of 4 KB.

The size of the virtual address space varies for each hardware platform. On 32-bit x86 systems, the total virtual address space has a theoretical maximum of 4 GB. By default, Windows allocates the lower half of this address space (addresses 0x00000000 through 0x7FFFFFFF) to processes for their unique private storage and the upper half (addresses 0x80000000 through 0xFFFFFFFF) for its own protected OS memory utilization. The mappings of the lower half change to reflect the virtual address space of the currently executing process, but (most of) the mappings of the upper half always consist of the OS’s virtual memory. Windows supports boot-time options, such as the increaseuserva qualifier in the Boot Configuration Database (described in Chapter 5), that give processes running specially marked programs the ability to use up to 3 GB of private address space, leaving 1 GB for the OS. (By “specially marked,” we mean the large address space‒aware flag must be set in the header of the executable image.) This option allows applications such as database servers to keep larger portions of a database in the process address space, thus reducing the need to map subset views of the database on disk and therefore increasing overall performance (although in certain cases, the loss of 1 GB for the system can cause more pronounced system-wide performance losses). Figure 1-4 shows the two typical virtual address space layouts supported by 32-bit Windows. (The increaseuserva option allows executable images marked with the large address space–aware flag to use anywhere from 2 to 3 GB.)

Although 3 GB is better than 2 GB, it’s still not enough virtual address space to map very large (multi-gigabyte) databases. To address this need on 32-bit systems, Windows provides a mechanism called Address Windowing Extensions (AWE), which allows a 32-bit application to allocate up to 64 GB of physical memory and then map views, or windows, into its 2 GB virtual address space. Although using AWE puts the burden of managing the mapping of virtual to physical memory on the developer, it does address the need to directly access more physical memory than can be mapped at any one time in a 32-bit process address space.
64-bit Windows provides a much larger address space for processes: 128 TB on Windows 8.1, Server 2012 R2, and later systems. Figure 1-5 shows a simplified view of the 64-bit system address space layouts. (For a detailed description, see Chapter 5.) Note that these sizes do not represent the architectural limits for these platforms. Sixty-four bits of address space is 2 to the 64th power, or 16 EB (where 1 EB equals 1,024 PB, or 1,048,576 TB), but current 64-bit hardware limits this to smaller values. The unmapped region marked in figure 1-5 is much larger than the possible mapped region (about one million times larger on Windows 8), which means the images are (by far) not to scale.

Details of the implementation of the memory manager, including how address translation works and how Windows manages physical memory, are described in Chapter 5.
Kernel mode vs. user mode
To protect user applications from accessing and/or modifying critical OS data, Windows uses two processor access modes (even if the processor on which Windows is running supports more than two): user mode and kernel mode. User application code runs in user mode, whereas OS code (such as system services and device drivers) runs in kernel mode. Kernel mode refers to a mode of execution in a processor that grants access to all system memory and all CPU instructions. Some processors differentiate between such modes by using the term code privilege level or ring level, while others use terms such as supervisor mode and application mode. Regardless of what it’s called, by providing the operating system kernel with a higher privilege level than user mode applications have, the processor provides a necessary foundation for OS designers to ensure that a misbehaving application can’t disrupt the stability of the system as a whole.
![]() Note
Note
The architectures of the x86 and x64 processors define four privilege levels (or rings) to protect system code and data from being overwritten either inadvertently or maliciously by code of lesser privilege. Windows uses privilege level 0 (or ring 0) for kernel mode and privilege level 3 (or ring 3) for user mode. The reason Windows uses only two levels is that some hardware architectures, such as ARM today and MIPS/Alpha in the past, implemented only two privilege levels. Settling on the lowest minimum bar allowed for a more efficient and portable architecture, especially as the other x86/x64 ring levels do not provide the same guarantees as the ring 0/ring 3 divide.
Although each Windows process has its own private memory space, the kernel-mode OS and device-driver code share a single virtual address space. Each page in virtual memory is tagged to indicate what access mode the processor must be in to read and/or write the page. Pages in system space can be accessed only from kernel mode, whereas all pages in the user address space are accessible from user mode and kernel mode. Read-only pages (such as those that contain static data) are not writable from any mode. Additionally, on processors that support no-execute memory protection, Windows marks pages containing data as non-executable, thus preventing inadvertent or malicious code execution in data areas (if this feature, Data Execution Prevention [DEP] is enabled).
Windows doesn’t provide any protection for private read/write system memory being used by components running in kernel mode. In other words, once in kernel mode, OS and device-driver code has complete access to system-space memory and can bypass Windows security to access objects. Because the bulk of the Windows OS code runs in kernel mode, it is vital that components that run in kernel mode be carefully designed and tested to ensure they don’t violate system security or cause system instability.
This lack of protection also emphasizes the need to remain vigilant when loading a third-party device driver, especially if it’s unsigned, because once in kernel mode, the driver has complete access to all OS data. This risk was one of the reasons behind the driver-signing mechanism introduced in Windows 2000, which warns (and, if configured as such, blocks) the user if an attempt is made to add an unsigned plug-and-play driver (see Chapter 6, “I/O system,” for more information on driver signing), but does not affect other types of drivers. Also, a mechanism called Driver Verifier helps device-driver writers find bugs, such as buffer overruns or memory leaks, that can cause security or reliability issues. (Chapter 6 also discusses Driver Verifier.)
On 64-bit and ARM versions of Windows 8.1, the kernel-mode code-signing (KMCS) policy dictates that all device drivers (not just plug-and-play) must be signed with a cryptographic key assigned by one of the major code certification authorities. The user cannot explicitly force the installation of an unsigned driver, even as an administrator. As a one-time exception, however, this restriction can be disabled manually. This allows drivers to be self-signed and tested, places a watermark on the desktop wallpaper labeled “Test Mode,” and disables certain digital rights management (DRM) features.
On Windows 10, Microsoft implemented an even more significant change, which was enforced starting one year after release as part of the July Anniversary Update (version 1607). As of that time, all new Windows 10 drivers must be signed by only two of the accepted certification authorities with a SHA-2 Extended Validation (EV) Hardware certificate instead of the regular file-based SHA-1 certificate and its 20 authorities. Once EV-signed, the hardware driver must be submitted to Microsoft through the System Device (SysDev) portal for attestation signing, which will see the driver receive a Microsoft signature. As such, the kernel will sign only Microsoft-signed Windows 10 drivers with no exemptions except the aforementioned Test Mode. Drivers signed before the release date of Windows 10 (July 2015) can continue to load with their regular signature for the time being.
With Windows Server 2016, the operating system takes its strongest stance yet. On top of the aforementioned EV requirements, mere attestation signing is insufficient. For a Windows 10 driver to load on a server system, it must pass through stringent Windows Hardware Quality Labs (WHQL) certification as part of the Hardware Compatibility Kit (HCK) and be submitted for formal evaluation. Only WHQL-signed drivers—which provide certain compatibility, security, performance, and stability assurances to system administrators —will be allowed to load on such systems. All in all, the reduction of third-party drivers that are allowed to load in kernel mode memory should result in significant stability and security improvements.
Certain vendors, platforms, and even enterprise configurations of Windows can have any number of these signing policies customized, such as through the Device Guard technology, which we’ll briefly describe in the upcoming “Hypervisor” section, and later in Chapter 7. As such, an enterprise might require WHQL signatures even on Windows 10 client systems, or might request the omission of this requirement on a Windows Server 2016 system.
As you’ll see in Chapter 2, “System architecture,” user applications switch from user mode to kernel mode when they make a system service call. For example, a Windows ReadFile function eventually needs to call the internal Windows routine that actually handles reading data from a file. That routine, because it accesses internal system data structures, must run in kernel mode. The use of a special processor instruction triggers the transition from user mode to kernel mode and causes the processor to enter the system service dispatching code in the kernel. This in turn calls the appropriate internal function in Ntoskrnl.exe or Win32k.sys. Before returning control to the user thread, the processor mode is switched back to user mode. In this way, the OS protects itself and its data from perusal and modification by user processes.
![]() Note
Note
A transition from user mode to kernel mode (and back) does not affect thread scheduling per se. A mode transition is not a context switch. Further details on system service dispatching are included in Chapter 2.
Thus, it’s normal for a user thread to spend part of its time executing in user mode and part in kernel mode. In fact, because the bulk of the graphics and windowing system also runs in kernel mode, graphics-intensive applications spend more of their time in kernel mode than in user mode. An easy way to test this is to run a graphics-intensive application such as Microsoft Paint and watch the time split between user mode and kernel mode using one of the performance counters listed in Table 1-3. More advanced applications can use newer technologies such as Direct2D and DirectComposition, which perform bulk computations in user mode and send only the raw surface data to the kernel. This reduces the time spent transitioning between user and kernel modes.

EXPERIMENT: Kernel mode vs. user mode
1. Open the Start menu and type Run Performance Monitor (it should be suggested before you finish typing) to run Performance Monitor.
2. Select the Performance Monitor node under Performance/Monitoring Tools in the tree on the left side.
3. To delete the default counter showing the total CPU time, click the Delete button on the toolbar or press the Delete key on the keyboard.
4. Click the Add (+) button on the toolbar.
5. Expand the Processor counter section, click the % Privileged Time counter, and, while holding down the Ctrl key, click the % User Time counter.
6. Click Add, and then click OK.
7. Open a command prompt and type dir \\%computername%\c$ /s to run a directory scan of your C drive.

8. When you’re finished, close the tool.
1. If it’s not already running, run the Performance Monitor again. (If it is already running, start with a blank display by right-clicking in the graph area and selecting Remove All Counters.)
2. Click the Add button on the toolbar.
3. In the available counters area, expand the Process section.
4. Select the % Privileged Time and % User Time counters.
5. Select a few processes in the Instance box (such as mmc, csrss, and Idle).
6. Click Add, and then click OK.
7. Move the mouse rapidly back and forth.
8. Press Ctrl+H to turn on highlighting mode. This highlights the currently selected counter in black.
9. Scroll through the counters at the bottom of the display to identify the processes whose threads were running when you moved the mouse, and note whether they were running in user mode or kernel mode.
Hypervisor
Recent shifts in application and software models, such as the introduction of cloud-based services and the pervasiveness of IoT devices, have resulted in the need for operating systems and hardware vendors to figure out more efficient ways to virtualize other OS guests on the host hardware of the machine, whether to allow for hosting multiple tenants on a server farm and run 100 isolated websites on a single server or to permit developers to test dozens of different OS varieties without buying dedicated hardware. The need for fast, efficient, and secure virtualization has driven new models of computing and reasoning about software. In fact, today, certain software—such as Docker, which is supported in Windows 10 and Server 2016—runs in containers, which provide fully isolated virtual machines solely designed for running a single application stack or framework, pushing the boundaries of a guest/host even further.
To provide such virtualization services, almost all modern solutions employ the use of a hypervisor, which is a specialized and highly privileged component that allows for the virtualization and isolation of all resources on the machine, from virtual to physical memory, to device interrupts, and even to PCI and USB devices. Hyper-V is an example of such a hypervisor, which powers the Hyper-V client functionality exposed in Windows 8.1 and later. Competing products such as Xen, KVM, VMware, and VirtualBox all implement their own hypervisors, each with their own strengths and weaknesses.
Due to its highly privileged nature, and because it has access even greater than the kernel itself, a hypervisor has a distinct advantage that goes beyond merely running multiple guest instances of other operating systems: It can protect and monitor a single host instance to offer assurances and guarantees beyond what the kernel provides. In Windows 10, Microsoft now leverages the Hyper-V hypervisor to provide a new set of services known as virtualization-based security (VBS):
![]() Device Guard This provides Hypervisor Code Integrity (HVCI) for stronger code-signing guarantees over KMCS alone, and allows for the customization of the signature policy of the Windows OS, for both user-mode and kernel-mode code.
Device Guard This provides Hypervisor Code Integrity (HVCI) for stronger code-signing guarantees over KMCS alone, and allows for the customization of the signature policy of the Windows OS, for both user-mode and kernel-mode code.
![]() Hyper Guard This protects key kernel-related and hypervisor-related data structures and code.
Hyper Guard This protects key kernel-related and hypervisor-related data structures and code.
![]() Credential Guard This prevents unauthorized access to domain account credentials and secrets, combined with secure biometrics.
Credential Guard This prevents unauthorized access to domain account credentials and secrets, combined with secure biometrics.
![]() Application Guard This provides an even stronger sandbox for the Microsoft Edge browser.
Application Guard This provides an even stronger sandbox for the Microsoft Edge browser.
![]() Host Guardian and Shielded Fabric These leverage a virtual TPM (v-TPM) to protect a virtual machine from the infrastructure it’s running on.
Host Guardian and Shielded Fabric These leverage a virtual TPM (v-TPM) to protect a virtual machine from the infrastructure it’s running on.
Additionally, the Hyper-V hypervisor enables certain key kernel mitigations against exploits and other attackers. The key advantage of all these technologies is that unlike previous kernel-based security improvements, they are not vulnerable to malicious or badly written drivers, regardless of whether they are signed or not. This makes them highly resilient against today’s advanced adversaries. This is possible due to the hypervisor’s implementation of Virtual Trust Levels (VTLs). Because the normal operating system and its components are in a less privileged mode (VTL 0), but these VBS technologies run at VTL 1 (a higher privilege), they cannot be affected even by kernel mode code. As such, code remains within the realm of the VTL 0 privilege space. In this way, you can think of VTLs as orthogonal to the processor’s privilege levels: kernel and user mode exist within each VTL, and the hypervisor manages privileges across VTLs. Chapter 2 covers additional details on the hypervisor-assisted architecture, and Chapter 7 discusses these VBS security mechanisms in detail.
Firmware
Windows components increasingly rely on the security of the operating system and its kernel, and the latter now relies on the protection of the hypervisor. A question arises of what can ensure these components are loaded securely and can authenticate their contents. This is typically the job of the boot loader, but it, too, needs the same level of authenticity checking, creating an increasingly complicated hierarchy of trust.
What, then, provides a root chain of trust that can guarantee an unencumbered boot process? In modern Windows 8 and later systems, this falls under the purview of the system firmware, which must be UEFI-based on certified systems. As part of the UEFI standard, which Windows dictates (UEFI 2.3.1b; see http://www.uefi.org for more information), a secure boot implementation with strong guarantees and requirements around the signature qualities of the boot-related software must be present. Through this verification process, Windows components are guaranteed to load securely from the very beginning of the boot process. In addition, technologies such as Trusted Platform Module (TPM) can measure the process to provide attestation (both local and remote). Through partnerships with the industry, Microsoft manages the whitelist and blacklist of the UEFI secure boot component in case of boot software errors or compromise, and Windows updates now include firmware updates as well. Although we won’t talk about firmware again until Chapter 11, “Startup and shutdown,” in Part 2, it’s important now to state its significance in modern Windows architecture, through the guarantees its meant to provide.
Terminal Services and multiple sessions
Terminal Services refers to the support in Windows for multiple interactive user sessions on a single system. With Windows Terminal Services, a remote user can establish a session on another machine, log in, and run applications on the server. The server transmits the graphical user interface (GUI) to the client (as well as other configurable resources such as audio and clipboard), and the client transmits the user’s input back to the server. (Similar to the X Window System, Windows permits running individual applications on a server system with the display remoted to the client instead of remoting the entire desktop.)
The first session is considered the services session, or session zero, and contains system service hosting processes (explained in further detail in Chapter 9 in Part 2). The first login session at the physical console of the machine is session one, and additional sessions can be created through the use of the remote desktop connection program (Mstsc.exe) or through the use of fast user switching.
Windows client editions permit a single remote user to connect to the machine, but if someone is logged in at the console, the workstation is locked. That is, someone can be using the system either locally or remotely, but not at the same time. Windows editions that include Windows Media Center allow one interactive session and up to four Windows Media Center Extender sessions.
Windows server systems support two simultaneous remote connections. This is to facilitate remote management—for example, using management tools that require you to be logged in to the machine being managed. They also support more than two remote sessions if appropriately licensed and configured as a terminal server.
All Windows client editions support multiple sessions, created locally through a feature called fast user switching, that can be used one at a time. When a user chooses to disconnect their session instead of log off (for example, by clicking the Start button, clicking the current user, and choosing Switch Account from the submenu that appears or by holding down the Windows key, pressing L, and then clicking a different user in the bottom-left corner of the screen), the current session—that is, the processes running in that session and all the session-wide data structures that describe the session—remains active in the system and the system returns to the main logon screen (if it’s not already there). If a new user logs in, a new session is created.
For applications that want to be aware of running in a terminal server session, there are a set of Windows APIs for programmatically detecting that as well as for controlling various aspects of Terminal Services. (See the Windows SDK and the Remote Desktop Services API for details.)
Chapter 2 briefly describes how sessions are created and contains some experiments showing how to view session information with various tools, including the kernel debugger. The “Object manager” section in Chapter 8 in Part 2 describes how the system namespace for objects is instantiated on a per-session basis and how applications that need to be aware of other instances of themselves on the same system can accomplish that. Finally, Chapter 5 covers how the memory manager sets up and manages session-wide data.
Objects and handles
In the Windows OS, a kernel object is a single, run-time instance of a statically defined object type. An object type comprises a system-defined data type, functions that operate on instances of the data type, and a set of object attributes. If you write Windows applications, you might encounter process, thread, file, and event objects, to name just a few examples. These objects are based on lower-level objects that Windows creates and manages. In Windows, a process is an instance of the process object type, a file is an instance of the file object type, and so on.
An object attribute is a field of data in an object that partially defines the object’s state. An object of type process, for example, would have attributes that include the process ID, a base scheduling priority, and a pointer to an access token object. Object methods, the means for manipulating objects, usually read or change object attributes. For example, the open method for a process would accept a process identifier as input and return a pointer to the object as output.
![]() Note
Note
There is a parameter named ObjectAttributes that a caller supplies when creating an object using the kernel object manager APIs. That parameter shouldn’t be confused with the more general meaning of the term as used in this book, however.
The most fundamental difference between an object and an ordinary data structure is that the internal structure of an object is opaque. You must call an object service to get data out of or put data into an object. You can’t directly read or change data inside an object. This difference separates the underlying implementation of the object from code that merely uses it, a technique that allows object implementations to be changed easily over time.
Objects, through the help of a kernel component called the object manager, provide a convenient means for accomplishing the following four important OS tasks:
![]() Providing human-readable names for system resources
Providing human-readable names for system resources
![]() Sharing resources and data among processes
Sharing resources and data among processes
![]() Protecting resources from unauthorized access
Protecting resources from unauthorized access
![]() Reference tracking, which allows the system to recognize when an object is no longer in use so that it can be automatically deallocated
Reference tracking, which allows the system to recognize when an object is no longer in use so that it can be automatically deallocated
Not all data structures in the Windows OS are objects. Only data that needs to be shared, protected, named, or made visible to user-mode programs (via system services) is placed in objects. Structures used by only one component of the OS to implement internal functions are not objects. Objects and handles (references to objects) are discussed in more detail in Chapter 8 in Part 2.
Security
Windows was designed from the start to be secure and to meet the requirements of various formal government and industry security ratings, such as the Common Criteria for Information Technology Security Evaluation (CCITSE) specification. Achieving a government-approved security rating allows an OS to compete in that arena. Of course, many of these capabilities are advantageous features for any multiuser system.
The core security capabilities of Windows include:
![]() Discretionary (need-to-know) and mandatory protection for all shareable system objects, such as files, directories, processes, threads, and so forth
Discretionary (need-to-know) and mandatory protection for all shareable system objects, such as files, directories, processes, threads, and so forth
![]() Security auditing for accountability of subjects, or users, and the actions they initiate
Security auditing for accountability of subjects, or users, and the actions they initiate
![]() User authentication at logon
User authentication at logon
![]() The prevention of one user from accessing uninitialized resources, such as free memory or disk space, that another user has deallocated
The prevention of one user from accessing uninitialized resources, such as free memory or disk space, that another user has deallocated
Windows has three forms of access control over objects:
![]() Discretionary access control This is the protection mechanism that most people think of when they think of OS security. It’s the method by which owners of objects (such as files or printers) grant or deny access to others. When users log in, they are given a set of security credentials, or a security context. When they attempt to access objects, their security context is compared to the access control list on the object they are trying to access to determine whether they have permission to perform the requested operation. With Windows Server 2012 and Windows 8, this form of discretionary control is further improved by implementing attribute-based access control (also called Dynamic Access Control). However, a resource’s access control list does not necessarily identify individual users and groups. Instead, it identifies required attributes or claims that grant access to a resource, such as “Clearance Level: Top Secret” or “Seniority: 10 Years.” With the ability to populate such attributes automatically by parsing SQL databases and schemas through Active Directory, this significantly more elegant and flexible security model helps organizations avoid cumbersome manual group management and group hierarchies.
Discretionary access control This is the protection mechanism that most people think of when they think of OS security. It’s the method by which owners of objects (such as files or printers) grant or deny access to others. When users log in, they are given a set of security credentials, or a security context. When they attempt to access objects, their security context is compared to the access control list on the object they are trying to access to determine whether they have permission to perform the requested operation. With Windows Server 2012 and Windows 8, this form of discretionary control is further improved by implementing attribute-based access control (also called Dynamic Access Control). However, a resource’s access control list does not necessarily identify individual users and groups. Instead, it identifies required attributes or claims that grant access to a resource, such as “Clearance Level: Top Secret” or “Seniority: 10 Years.” With the ability to populate such attributes automatically by parsing SQL databases and schemas through Active Directory, this significantly more elegant and flexible security model helps organizations avoid cumbersome manual group management and group hierarchies.
![]() Privileged access control This is necessary for those times when discretionary access control is not enough. It’s a method of ensuring that someone can get to protected objects if the owner isn’t available. For example, if an employee leaves a company, the administrator needs a way to gain access to files that might have been accessible only to that employee. In that case, under Windows, the administrator can take ownership of the file so that they can manage its rights as necessary.
Privileged access control This is necessary for those times when discretionary access control is not enough. It’s a method of ensuring that someone can get to protected objects if the owner isn’t available. For example, if an employee leaves a company, the administrator needs a way to gain access to files that might have been accessible only to that employee. In that case, under Windows, the administrator can take ownership of the file so that they can manage its rights as necessary.
![]() Mandatory integrity control This is required when an additional level of security control is needed to protect objects that are being accessed from within the same user account. It’s used for everything from providing part of the sandboxing technology for Windows Apps (see the upcoming discussion), to isolating Protected Mode Internet Explorer (and other browsers) from a user’s configuration, to protecting objects created by an elevated administrator account from access by a non-elevated administrator account. (See Chapter 7 for more information on User Account Control.)
Mandatory integrity control This is required when an additional level of security control is needed to protect objects that are being accessed from within the same user account. It’s used for everything from providing part of the sandboxing technology for Windows Apps (see the upcoming discussion), to isolating Protected Mode Internet Explorer (and other browsers) from a user’s configuration, to protecting objects created by an elevated administrator account from access by a non-elevated administrator account. (See Chapter 7 for more information on User Account Control.)
Starting with Windows 8, a sandbox called an AppContainer is used to host Windows Apps, which provides isolation with relation to other AppContainers and non–Windows Apps processes. Code in AppContainers can communicate with brokers (non-isolated processes running with the user’s credentials) and sometimes other AppContainers or processes through well-defined contracts provided by the Windows Runtime. A canonical example is the Microsoft Edge browser that runs inside an AppContainer and thus provides better protection against malicious code running within its boundaries. Additionally, third-party developers can leverage AppContainers to isolate their own non–Windows Apps applications in similar ways. The AppContainer model forces a significant shift in traditional programming paradigms, moving from the traditional multithreaded single-process application implementation to a multi-process one.
Security pervades the interface of the Windows API. The Windows subsystem implements object-based security in the same way the OS does: protecting shared Windows objects from unauthorized access by placing Windows security descriptors on them. The first time an application tries to access a shared object, the Windows subsystem verifies the application’s right to do so. If the security check succeeds, the Windows subsystem allows the application to proceed.
For a comprehensive description of Windows security, see Chapter 7.
Registry
If you’ve worked with Windows operating systems, you’ve probably heard about or looked at the registry. You can’t talk much about Windows internals without referring to the registry because it’s the system database that contains the information required to boot and configure the system, system-wide software settings that control the operation of Windows, the security database, and per-user configuration settings such as which screen saver to use. In addition, the registry provides a window into in-memory volatile data, such as the current hardware state of the system (what device drivers are loaded, the resources they are using, and so on) as well as the Windows performance counters. The performance counters, which aren’t actually in the registry, can be accessed through the registry functions (although there is a newer, better API for accessing performance counters). See Chapter 9 in Part 2 for more on how performance counter information is accessed from the registry.
Although many Windows users and administrators will never need to look directly into the registry (because you can view or change most configuration settings with standard administrative utilities), it is still a useful source of Windows internals information because it contains many settings that affect system performance and behavior. You’ll find references to individual registry keys throughout this book as they pertain to the component being described. Most registry keys referred to in this book are under the system-wide configuration hive, HKEY_LOCAL_MACHINE, which we’ll abbreviate throughout as HKLM.
![]() Caution
Caution
If you decide to directly change registry settings, you must exercise extreme caution. Any changes might adversely affect system performance or, worse, cause the system to fail to boot successfully.
For further information on the registry and its internal structure, see Chapter 9 in Part 2.
Unicode
Windows differs from most other operating systems in that most internal text strings are stored and processed as 16-bit-wide Unicode characters (technically UTF-16LE; when Unicode is mentioned in this book it refers to UTF-16LE unless otherwise stated). Unicode is an international character set standard that defines unique values for most of the world’s known character sets, and provides 8, 16, and even 32-bit encodings for each character.
Because many applications deal with 8-bit (single-byte) ANSI character strings, many Windows functions that accept string parameters have two entry points: a Unicode (wide, 16-bit) version and an ANSI (narrow, 8-bit) version. If you call the narrow version of a Windows function, there is a slight performance impact as input string parameters are converted to Unicode before being processed by the system and output parameters are converted from Unicode to ANSI before being returned to the application. Thus, if you have an older service or piece of code that you need to run on Windows but this code is written using ANSI character text strings, Windows will convert the ANSI characters into Unicode for its own use. However, Windows never converts the data inside files—it’s up to the application to decide whether to store data as Unicode or as ANSI.
Regardless of language, all versions of Windows contain the same functions. Instead of having separate language versions, Windows has a single worldwide binary so that a single installation can support multiple languages (through the addition of various language packs). Applications can also take advantage of Windows functions that allow single worldwide application binaries that can support multiple languages.
The old Windows 9x operating systems did not support Unicode natively. This was yet another reason for the creation of two functions for ANSI and Unicode. For example, the Windows API function CreateFile is not a function at all; instead, it’s a macro that expands to one of two functions: CreateFileA (ANSI) or CreateFileW (Unicode, where W stands for wide). The expansion is based on a compilation constant named UNICODE. It’s defined by default in Visual Studio C++ projects because it’s more beneficial to work with the Unicode functions. However, the explicit function name can be used in lieu of the appropriate macro. The following experiment shows these pairs of functions.
EXPERIMENT: Viewing exported functions
1. Download Dependency Walker from http://www.dependencywalker.com. If you have a 32-bit system, download the 32-bit version of Download Dependency. Or, if you have a 64-bit system, download the 64-bit version. Then extract the downloaded ZIP file to a folder of your choice.
2. Run the tool (depends.exe). Then open the File menu and choose Open, navigate to the C:\Windows\System32 folder (assuming Windows is installed on your C drive), locate the kernel32.dll file and click Open.
3. Dependency Walker may show a warning message box. Disregard it and dismiss the message box.
4. You’ll see several views with vertical and horizontal splitter bars. Make sure the item selected in the top-left tree view is kernel32.dll.
5. Look at the second view from the top on the right side. This view lists the exported functions available in kernel32.dll. Click the Function list header to sort by name. Then locate the function CreateFileA. You’ll find CreateFileW not much farther down, as shown here:

6. As you can see, most functions that have at least one string type argument are in fact pairs of functions. In the preceding graphic, the following are visible: CreateFileMappingA/W, CreateFileTransactedA/W, and CreateFileMappingNumaA/W.
7. You can scroll the list to locate others. You can also open other system files, such as user32.dll and advapi32.dll.
![]() Note
Note
The COM-based APIs in Windows typically use Unicode strings, sometimes typed as BSTR. This is essentially a null-terminated array of Unicode characters with the length of the string in bytes stored 4 bytes before the start of the array of characters in memory. The Windows Runtime APIs use Unicode strings only, typed as HSTRING, which is an immutable array of Unicode characters.
For more information about Unicode, see http://www.unicode.org and the programming documentation in the MSDN Library.
Digging into Windows internals
Although much of the information in this book is based on reading Windows source code and talking to developers, you don’t have to take everything on faith. Many details about the internals of Windows can be exposed and demonstrated by using a variety of available tools, such as those that come with Windows and the Windows debugging tools. These tool packages are briefly described later in this section.
To encourage your exploration of Windows internals, we’ve included “Experiment” sidebars throughout the book that describe steps you can take to examine a particular aspect of Windows internal behavior. (You already saw a few of these sidebars earlier in this chapter.) We encourage you to try these experiments so you can see in action many of the internals topics described in this book.
Table 1-4 shows a list of the principal tools used in this book and where they come from.

Performance Monitor and Resource Monitor
We refer to Performance Monitor—which you can access from the Administrative Tools folder in the Control Panel or by typing perfmon in the Run dialog box—throughout this book. Specifically, we focus on Performance Monitor and Resource Monitor.
![]() Note
Note
Performance Monitor has three functions: system monitoring, viewing performance counter logs, and setting alerts (by using data collector sets, which also contain performance counter logs and trace and configuration data). For simplicity, when we refer to Performance Monitor, we mean the system-monitoring function within that tool.
Performance Monitor provides more information about how your system is operating than any other single utility. It includes hundreds of base and extensible counters for various objects. For each major topic described in this book, a table of the relevant Windows performance counters is included. Performance Monitor contains a brief description for each counter. To see the descriptions, select a counter in the Add Counters window and select the Show Description check box.
Although all the low-level system monitoring we’ll do in this book can be done with Performance Monitor, Windows also includes a Resource Monitor utility (accessible from the Start menu or from the Task Manager Performance tab) that shows four primary system resources: CPU, disk, network, and memory. In their basic states, these resources are displayed with the same level of information that you would find in Task Manager. However, they also provide sections that can be expanded for more information. Here’s a typical view of Resource Monitor:

When expanded, the CPU tab displays information about per-process CPU usage, just like Task Manager. However, it adds a column for average CPU usage, which can give you a better idea of which processes are most active. The CPU tab also includes a separate display of services and their associated CPU usage and average. Each service-hosting process is identified by the service group it is hosting. As with Process Explorer, selecting a process (by clicking its associated check box) will display a list of named handles opened by the process, as well as a list of modules (such as DLLs) that are loaded in the process address space. The Search Handles box can also be used to search for which processes have opened a handle to a given named resource.
The Memory tab displays much of the same information that one can obtain with Task Manager, but it is organized for the entire system. A physical memory bar graph displays the current organization of physical memory into either hardware-reserved, in-use, modified, standby, or free memory. See Chapter 5 for the exact meaning of these terms.
The Disk tab, on the other hand, displays per-file information for I/O in a way that makes it easy to identify the most-accessed, the most–written to, or the most–read from files on the system. These results can be further filtered down by process.
The Network tab displays the active network connections, the processes that own them, and how much data is going through them. This information makes it possible to see background network activity that might be hard to detect otherwise. In addition, it shows the TCP connections that are active on the system, organized by process, with data such as the remote and local port and address and packet latency. Finally, it displays a list of listening ports by process, allowing an administrator to see which services or applications are currently waiting for connections on a given port. The protocol and firewall policy for each port and process is also shown.
All Windows performance counters are accessible programmatically. For more information, search for “performance counters” in the MSDN documentation.
Kernel debugging
Kernel debugging means examining internal kernel data structures and/or stepping through functions in the kernel. It is a useful way to investigate Windows internals because you can display internal system information not available through any other tools and get a clearer idea of code flows within the kernel. Before describing the various ways in which you can debug the kernel, let’s examine a set of files that you’ll need in order to perform any type of kernel debugging.
Symbols for kernel debugging
Symbol files contain the names of functions and variables and the layout and format of data structures. They are generated by the linker and used by debuggers to reference and display these names during a debug session. This information is not usually stored in the binary image because it is not needed to execute the code. This means binaries are smaller and faster. However, it also means that when debugging, you must make sure the debugger can access the symbol files associated with the images you are referencing during a debugging session.
To use any of the kernel-debugging tools to examine internal Windows kernel data structures such as the process list, thread blocks, loaded driver list, memory usage information, and so on, you must have the correct symbol files for at least the kernel image, Ntoskrnl.exe. (You can learn more about this file in the section “Architecture overview” in Chapter 2.) Symbol table files must match the version of the image from which they were taken. For example, if you install a Windows service pack or hot fix that updates the kernel, you must obtain the matching updated symbol files.
While it is possible to download and install symbols for various versions of Windows, updated symbols for hot fixes are not always available. The easiest way to obtain the correct version of symbols for debugging is to employ the Microsoft on-demand symbol server by using a special syntax for the symbol path that you specify in the debugger. For example, the following symbol path causes the debugging tools to load required symbols from the Internet symbol server and keep a local copy in the C:\symbols folder:
srv*c:\symbols*http://msdl.microsoft.com/download/symbols
Debugging Tools for Windows
The Debugging Tools for Windows package contains advanced debugging tools, which are used in this book to explore Windows internals. The latest version is included as part of the Windows SDK. (See https://msdn.microsoft.com/en-us/library/windows/hardware/ff551063.aspx for more details about the different installation types.) These tools can be used to debug user-mode processes as well as the kernel.
There are four debuggers included in the tools: cdb, ntsd, kd, and WinDbg. All are based on a single debugging engine implemented in DbgEng.dll, which is documented fairly well in the help file for the tools. Here’s a brief overview of the debuggers:
![]() cdb and ntsd are user-mode debuggers based on a console user interface. The only difference between them is that ntsd opens a new console window if activated from an existing console window, while cdb does not.
cdb and ntsd are user-mode debuggers based on a console user interface. The only difference between them is that ntsd opens a new console window if activated from an existing console window, while cdb does not.
![]() kd is a kernel-mode debugger based on a console user interface.
kd is a kernel-mode debugger based on a console user interface.
![]() WinDbg can be used as a user-mode or kernel-mode debugger, but not both at the same time. It provides a GUI for the user.
WinDbg can be used as a user-mode or kernel-mode debugger, but not both at the same time. It provides a GUI for the user.
![]() The user-mode debuggers (cdb, ntsd, and WinDbg, when used as such) are essentially equivalent. Usage of one or the other is a matter of preference.
The user-mode debuggers (cdb, ntsd, and WinDbg, when used as such) are essentially equivalent. Usage of one or the other is a matter of preference.
![]() The kernel-mode debuggers (kd and WinDbg, when used as such) are equivalent as well.
The kernel-mode debuggers (kd and WinDbg, when used as such) are equivalent as well.
User-mode debugging The debugging tools can also be used to attach to a user-mode process and to examine and/or change process memory. There are two options when attaching to a process:
![]() Invasive Unless specified otherwise, when you attach to a running process, you use the
Invasive Unless specified otherwise, when you attach to a running process, you use the DebugActiveProcess Windows function to establish a connection between the debugger and the debugee. This permits you to examine and/or change process memory, set breakpoints, and perform other debugging functions. Windows allows you to stop debugging without killing the target process as long as the debugger is detached, not killed.
![]() Noninvasive With this option, the debugger simply opens the process with the
Noninvasive With this option, the debugger simply opens the process with the OpenProcess function. It does not attach to the process as a debugger. This allows you to examine and/or change memory in the target process, but you cannot set breakpoints. This also means it’s possible to attach noninvasively even if another debugger is attached invasively.
You can also open user-mode process dump files with the debugging tools. User-mode dump files are explained in Chapter 8 in Part 2 in the section on exception dispatching.
Kernel-mode debugging As mentioned, there are two debuggers that can be used for kernel debugging: a command-line version (Kd.exe) and a GUI version (Windbg.exe). You can perform three types of kernel debugging with these tools:
![]() Open a crash dump file created as a result of a Windows system crash. (See Chapter 15, “Crash dump analysis,” in Part 2 for more information on kernel crash dumps.)
Open a crash dump file created as a result of a Windows system crash. (See Chapter 15, “Crash dump analysis,” in Part 2 for more information on kernel crash dumps.)
![]() Connect to a live, running system and examine the system state (or set breakpoints if you’re debugging device driver code). This operation requires two computers: a target (the system being debugged) and a host (the system running the debugger). The target system can be connected to the host via a null modem cable, an IEEE 1394 cable, a USB 2.0/3.0 debugging cable, or the local network. The target system must be booted in debugging mode. You can configure the system to boot in debugging mode using Bcdedit.exe or Msconfig.exe. (Note that you may have to disable secure boot in the UEFI BIOS settings.) You can also connect through a named pipe—which is useful when debugging Windows 7 or earlier versions through a virtual machine product such as Hyper-V, Virtual Box, or VMWare Workstation—by exposing the guest operating system’s serial port as a named pipe device. For Windows 8 and later guests, you should instead use local network debugging by exposing a host-only network using a virtual NIC in the guest operating system. This will result in 1,000x performance gain.
Connect to a live, running system and examine the system state (or set breakpoints if you’re debugging device driver code). This operation requires two computers: a target (the system being debugged) and a host (the system running the debugger). The target system can be connected to the host via a null modem cable, an IEEE 1394 cable, a USB 2.0/3.0 debugging cable, or the local network. The target system must be booted in debugging mode. You can configure the system to boot in debugging mode using Bcdedit.exe or Msconfig.exe. (Note that you may have to disable secure boot in the UEFI BIOS settings.) You can also connect through a named pipe—which is useful when debugging Windows 7 or earlier versions through a virtual machine product such as Hyper-V, Virtual Box, or VMWare Workstation—by exposing the guest operating system’s serial port as a named pipe device. For Windows 8 and later guests, you should instead use local network debugging by exposing a host-only network using a virtual NIC in the guest operating system. This will result in 1,000x performance gain.
![]() Windows systems also allow you to connect to the local system and examine the system state. This is called local kernel debugging. To initiate local kernel debugging with WinDbg, first make sure the system is set to debug mode (for example, by running msconfig.exe, clicking the Boot tab, selecting Advanced Options, selecting Debug, and restarting Windows). Launch WinDbg with admin privileges and open the File menu, choose Kernel Debug, click the Local tab, and then click OK (or use bcdedit.exe). Figure 1-6 shows a sample output screen on a 64-bit Windows 10 machine. Some kernel debugger commands do not work when used in local kernel debugging mode, such as setting breakpoints or creating a memory dump with the
Windows systems also allow you to connect to the local system and examine the system state. This is called local kernel debugging. To initiate local kernel debugging with WinDbg, first make sure the system is set to debug mode (for example, by running msconfig.exe, clicking the Boot tab, selecting Advanced Options, selecting Debug, and restarting Windows). Launch WinDbg with admin privileges and open the File menu, choose Kernel Debug, click the Local tab, and then click OK (or use bcdedit.exe). Figure 1-6 shows a sample output screen on a 64-bit Windows 10 machine. Some kernel debugger commands do not work when used in local kernel debugging mode, such as setting breakpoints or creating a memory dump with the .dump command. However, the latter can be done with LiveKd, described later in this section.

Once connected in kernel-debugging mode, you can use one of the many debugger extension commands—also known as bang commands, which are commands that begin with an exclamation point (!)—to display the contents of internal data structures such as threads, processes, I/O request packets, and memory management information. Throughout this book, the relevant kernel debugger commands and output are included as they apply to each topic being discussed. An excellent companion reference is the Debugger.chm help file, contained in the WinDbg installation folder, which documents all the kernel debugger functionality and extensions. In addition, the dt (display type) command can format more than 1,000 kernel structures because the kernel symbol files for Windows contain type information that the debugger can use to format structures.
The dt command even lets you specify the level of recursion of structures by appending a number to the -r switch. The following example means one level of recursion:
lkd> dt nt!_KINTERRUPT -r1
The Debugging Tools for Windows help file explains how to set up and use kernel debuggers. For additional details on using kernel debuggers aimed primarily at device-driver writers, see the WDK documentation.
LiveKd tool
LiveKd is a free tool from Sysinternals that enables you to use the standard Microsoft kernel debuggers just described to examine the running system without booting the system in debugging mode. This approach might be useful when kernel-level troubleshooting is required on a machine that wasn’t booted in debugging mode. Certain issues might be hard to reproduce reliably, so a reboot with the debug option enabled might not readily exhibit the error.
You run LiveKd just as you would WinDbg or kd. LiveKd passes any command-line options you specify to the debugger you select. By default, LiveKd runs the command-line kernel debugger (kd). To have it run WinDbg, use the -w switch. To see the help files for LiveKd switches, use the -? switch.
LiveKd presents a simulated crash dump file to the debugger so you can perform any operations in LiveKd that are supported on a crash dump. Because LiveKd relies on physical memory to back the simulated dump, the kernel debugger might run into situations in which data structures are in the middle of being changed by the system and are inconsistent. Each time the debugger is launched, it starts with a fresh view of the system state. If you want to refresh the snapshot, enter the q command to quit the debugger. LiveKd will ask you whether you want to start it again. If the debugger enters a loop in printing output, press Ctrl+C to interrupt the output and quit. If it hangs, press Ctrl+Break, which will terminate the debugger process. LiveKd will then ask you whether you want to run the debugger again.
Windows Software Development Kit
The Windows Software Development Kit (SDK) is available as part of the MSDN subscription program. You can also download it for free from https://developer.microsoft.com/en-US/windows/downloads/windows-10-sdk. Visual Studio also provides the option of installing the SDK as part of VS installation. The versions contained in the Windows SDK always match the latest version of the Windows operating system, whereas the version that comes with Visual Studio might be an older version that was current when that version was released. Besides the Debugging Tools for Windows, it contains the C header files and the libraries necessary to compile and link Windows applications. From a Windows internals perspective, items of interest in the Windows SDK include the Windows API header files—for example, C:\Program Files (x86)\Windows Kits\10\Include—and the SDK tools (search for the Bin folder). Also of interest is the documentation. It’s available online or can be downloaded for offline access. A few of these tools are also shipped as sample source code in both the Windows SDK and the MSDN Library.
Windows Driver Kit
The Windows Driver Kit (WDK) is also available through the MSDN subscription program. Just like the Windows SDK, it is available for free download. The WDK documentation is included in the MSDN Library.
Although the WDK is aimed at developers of device drivers, it is an abundant source of Windows internals information. For example, although Chapter 6 describes the I/O system architecture, driver model, and basic device driver data structures, it does not describe the individual kernel support functions in detail. The WDK documentation contains a comprehensive description of all the Windows kernel support functions and mechanisms used by device drivers in both tutorial and reference form.
In addition to including the documentation, the WDK contains header files (in particular, ntddk.h, ntifs.h, and wdm.h) that define key internal data structures and constants as well as interfaces to many internal system routines. These files are useful when exploring Windows internal data structures with the kernel debugger because although the general layout and content of these structures are shown in this book, detailed field-level descriptions (such as size and data types) are not. A number of these data structures—such as object dispatcher headers, wait blocks, events, mutants, semaphores, and so on—are, however, fully described in the WDK.
If you want to dig into the I/O system and driver model beyond what is presented in this book, read the WDK documentation—especially the Kernel-Mode Driver Architecture Design Guide and Kernel-Mode Driver Reference manuals. You might also find useful Programming the Microsoft Windows Driver Model, Second Edition by Walter Oney (Microsoft Press, 2002) and Developing Drivers with the Windows Driver Foundation by Penny Orwick and Guy Smith (Microsoft Press, 2007).
Sysinternals tools
Many experiments in this book use freeware tools that you can download from Sysinternals. Mark Russinovich, coauthor of this book, wrote most of these tools. The most popular tools include Process Explorer and Process Monitor. Note that many of these utilities involve the installation and execution of kernel-mode device drivers and thus require administrator, or elevated, privileges—although some of them can run with limited functionality and output on a standard, or non-elevated, user account.
Because the Sysinternals tools are updated frequently, be make sure you have the latest version. To be notified of tool updates, you can follow the Sysinternals Site Blog (which has an RSS feed). For a description of all the tools, a description of how to use them, and case studies of problems solved, see Windows Sysinternals Administrator’s Reference by Mark Russinovich and Aaron Margosis (Microsoft Press, 2011). For questions and discussions on the tools, use the Sysinternals Forums.
Conclusion
This chapter introduced key Windows technical concepts and terms that will be used throughout the book. It also offered a glimpse of the many useful tools available for digging into Windows internals. Now you’re ready to begin your exploration of the internal design of the system, beginning with an overall view of the system architecture and its key components.


Comments
Post a Comment